I'm going to start with a three part series on my solar and atmosphere data collection setup. I talk to a lot of people about it (whether they want to hear it or not) so I figured this would be a good place to start a new blog. This setup is the culmination of 1.5 years of learning for me. It started when my wife purchased me a Raspberry Pi to build a weather station back in December of 2017. I started to learn how to code with the materials that came with the pi and soon realized the Sense Hat that came with the Pi wouldn't do it for me. In my search for a solution I came across Arduino and eventually the ESP8266. Since then I have learned some Arduino, Python, assembly code, and web development. The weather station still hasn't fully come to fruition but it will make it someday. I hope you are able to learn something along the way about electrical engineering, coding, or web development.
Part I
An Overview
Here's a rundown of how my home system is setup.
The heart of my IOT system is the Raspberry Pi. It is the MQTT broker, wireless access point, database server, local web server, and it runs my scripts to keep everything organized.
What is a Raspberry Pi?
A Raspberry Pi is not edible contrary to popular opinion. A Pi (for short) is a small computer that runs on a linux operating system. It's pretty cheap at $35. It's highly versatile with today's models offering wifi and bluetooth built-in. It also sports HDMI, USB (duh), Ethernet, 3.5mm audio, and GPIO ports. GPIO is general purpose input/output. These ports are simple pins you can turn on or off, read data from, send data through, and many other cool things.
What is IOT?
Generally, IOT (Internet of Things) is the interconnection of physical things, computers, and the internet. IOT is Alexa turning on your kitchen light when you tell her to. It's your refrigerator sending you an alert if you leave the door open. It's the fancy new camera doorbells that allow you to see who's on your front porch while you are on vacation in Uzbekistan. IOT is that potentially scary thing that is connecting everything and everyone through the internet. That's another post though.
What is MQTT?
MQTT is a lightweight communication protocol to share information to IOT devices. It is often called a pub/sub messaging protocol. What happens is a device (ie. temperature sensor) "publishes" a temperature under a topic (ie home/outdoor/temperature). The MQTT broker takes that data and stores it. If any other device is "subscribed" to that topic, the broker sends the data to that device. Pretty handy protocol.
Moving On
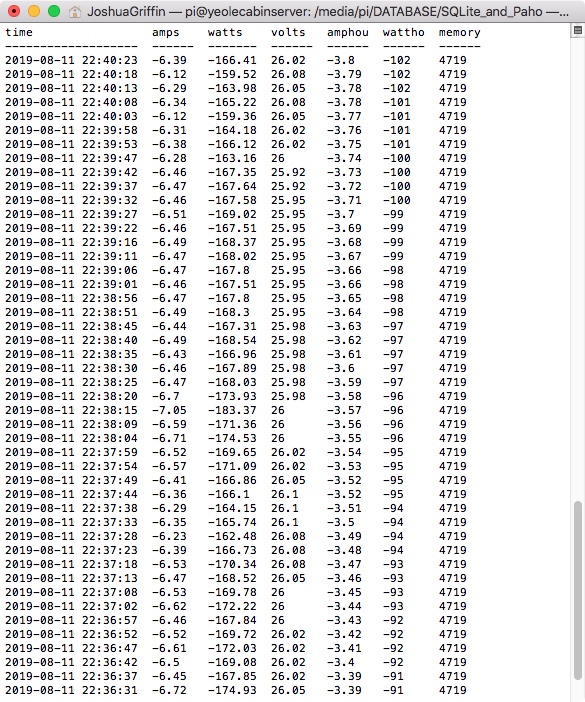
With all that out of the way, let's explain that picture above. The computer thing on the right is the Pi. It collects data wirelessly from other sensors around the house. Each sensor is connected to a separate small computer called a microcontroller. A microcontroller doesn't run an operating system, it just turns on and runs a single program. So each microcontroller periodically collects some data, sends it to the Pi, then the Pi stores that data in a database. Cool! we have data! But now we want to look at that data. What next? Looking at data like this isn't very appealing: 
So then I attached a small screen to a microcontroller, subscribed to every topic, and displayed the data as numbers. It was better but I could only see it at the house and it didn't show me trend. That same screen is still running and is useful to see how charged the batteries are or if it is cooler outside than inside so I can decide whether to open the windows or not. I wanted to view the data on my cell phone, however, and I wanted to see the data on shiny, interactive graphs. So that takes us to my last hurdle in this setup... web development.
Web Development (a.k.a. making it shiny)
Now, I know the least about web development of the three subjects here. One look at my website today and you can see that. I'm on my way to getting better and have at least accomplished my mission thus far. I set out to host my own website from the same Pi that does everything else at the house and got everything set up. I installed the NGINX server, PHP, MySQL, purchased a domain name, did all that other weird network stuff, write an index page and.... I could never view it outside my local network. As I dug a little I discovered that my satellite internet provider doesn't allow server hosting through them. Then I purchased a hosting service through namecheap and here we are. I now pay a little for a domain name and some space on a giant corporation's server. After pulling my hair out for days and driving my wife crazy, I learned just enough PHP, HTML, and javascript to display all this wonderful data on some nice graphs you can see at yeolecabin.com.
Concluding
There's a rundown. Almost nothing I did is "off the shelf." It hasn't been as fast or probably even as cheap as purchasing a pre-made kit but it has been a fun journey and now I have a skill set that will serve me for years to come. Stay tuned for Part II where I dig into the hardware that makes things possible. I will get more nerdy in the next episode.
Joshua @ Ye Ole Cabin
1 From Your Wifey -
So glad you're blogging again. I enjoy the way you write even if I don't understand it all ????
2 From berad199 -
Speak in more specific terms such as “thingamajig” or “doheenky”.
3 From Joshua -
@berad199, I will work on that. Haha. Gizmo is probably one of my favorites.
@Your Wifey, Thanks, it feels good to write again.